
EM Figure Library
Every electron micrograph on this site, in one place, so you can pull them into a deck without hunting through content pages.
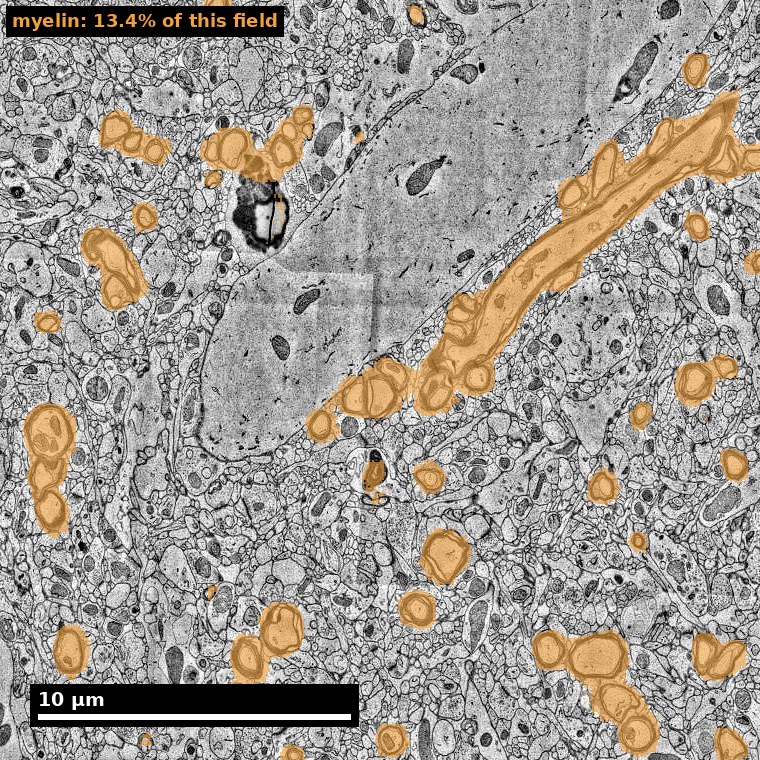
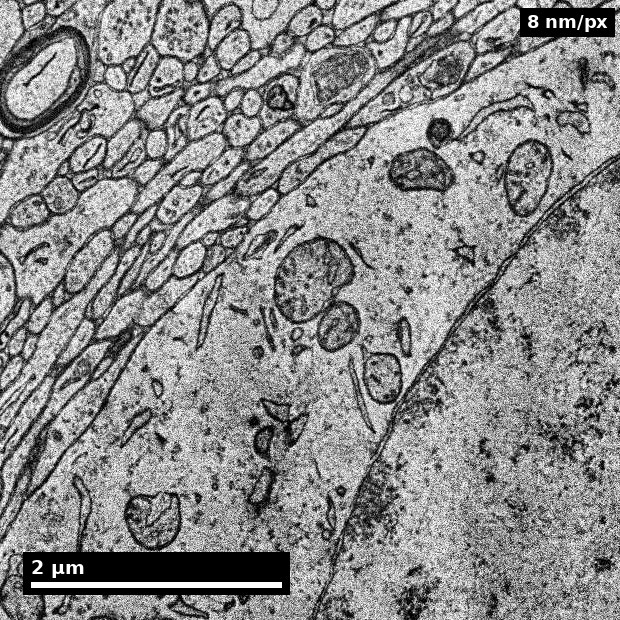
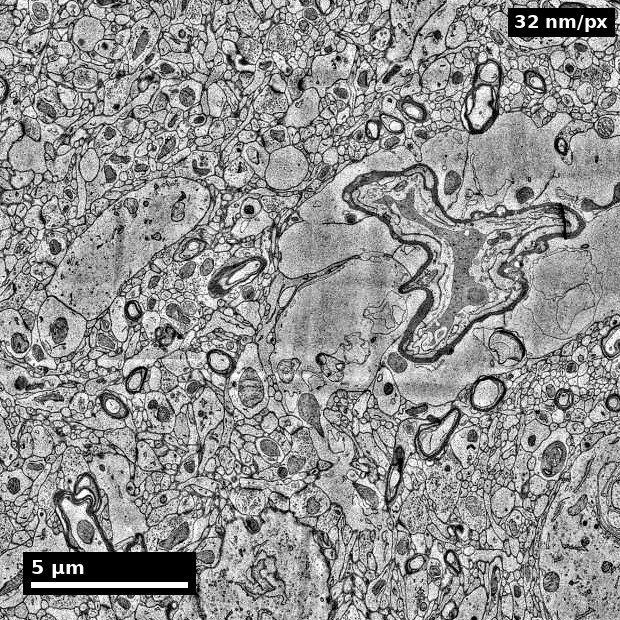
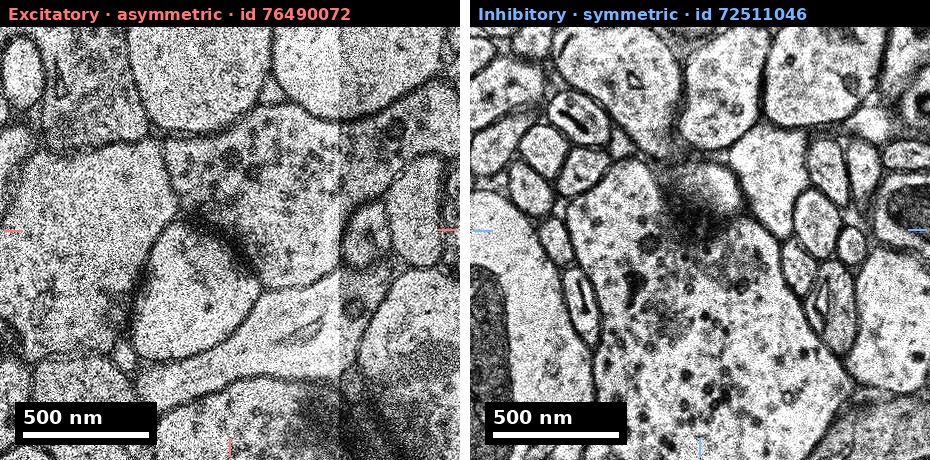
All of them are rendered from the public H01 human cortex volume — not copied from a publication, and not illustrations. Where a figure names a structure, that structure was located by querying H01’s own label layers, so “astrocytic process” means the dataset labels it an astrocyte.
Reuse: the H01 release states that "all released datasets are licensed under a Creative Commons Attribution 4.0 License." These renderings inherit that. Attribute as: H01 dataset, Lichtman Laboratory (Harvard University) and Connectomics at Google; Shapson-Coe et al., Science 384, eadk4858 (2024).
Regenerate: scripts/render_h01_figures.py and
scripts/render_em_figures.py rebuild every figure here from
scratch. Both work on any Neuroglancer precomputed dataset, so
the same code points at MICrONS or FlyWire.
Scale — from a whole sample to a synapse
Each step is roughly 4× closer than the last. Same tissue throughout.
One whole section
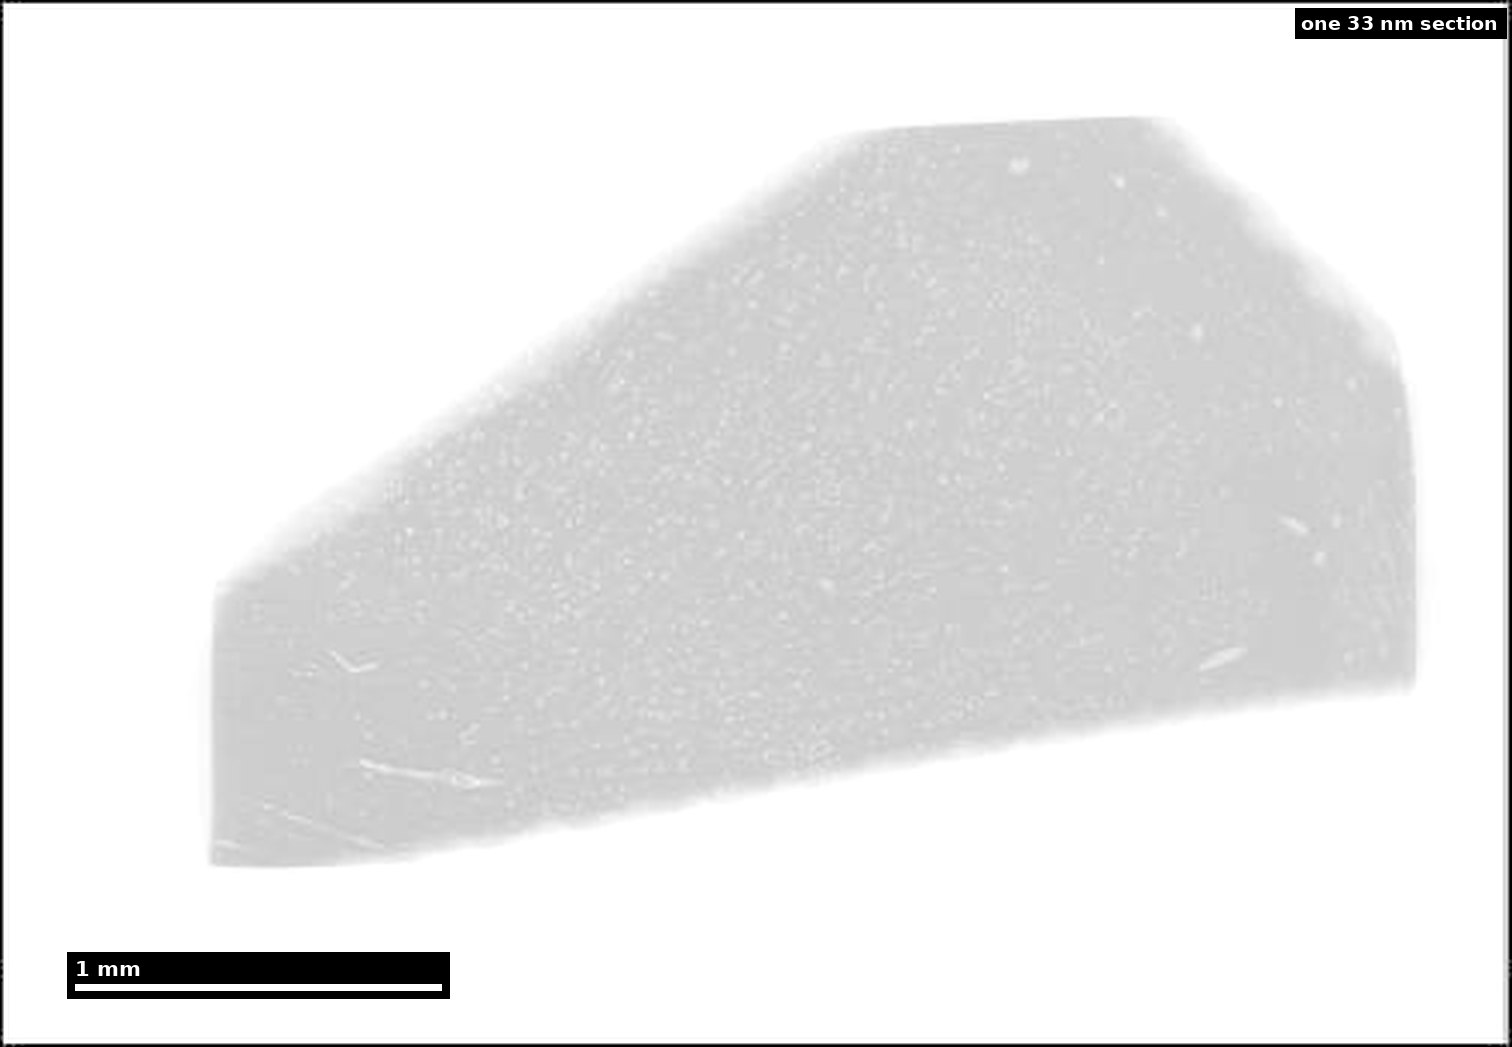
Slide line and file path
Marp:
File: /assets/images/content-library/case-studies/h01/01-whole-sample.jpg ·
open full size
≈460 µm — cell bodies and vessels
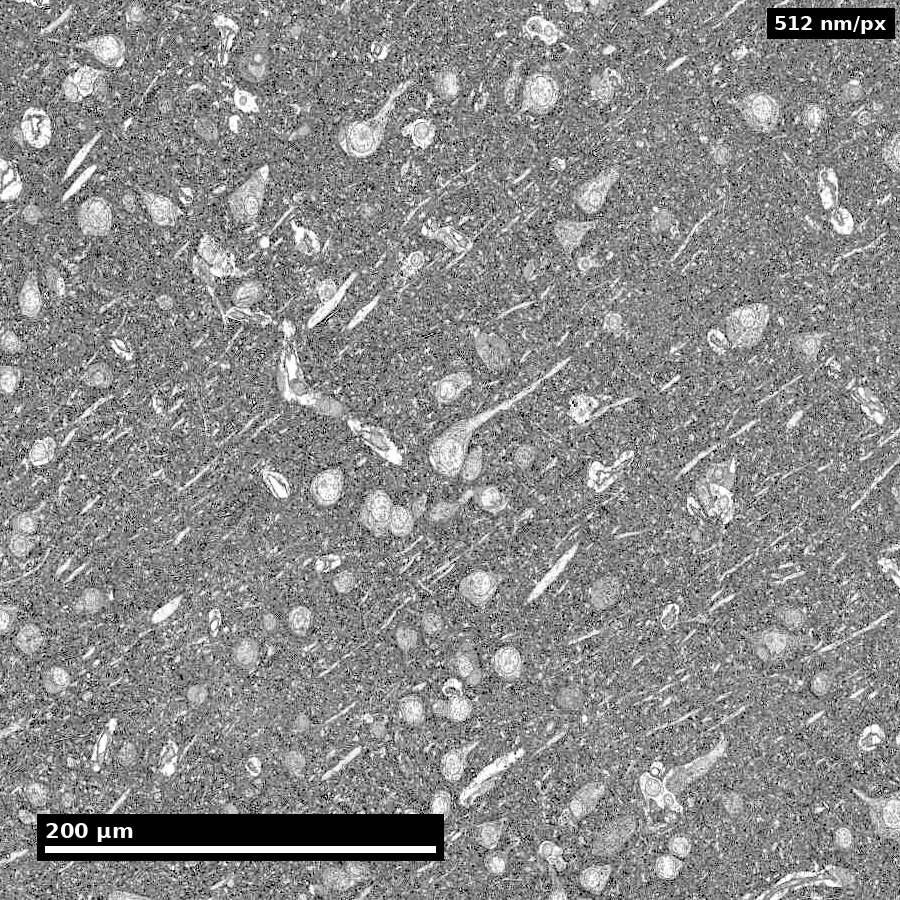
Slide line and file path
Marp:
File: /assets/images/content-library/case-studies/h01/03-cell-field.jpg ·
open full size
≈29 µm — a single neuron
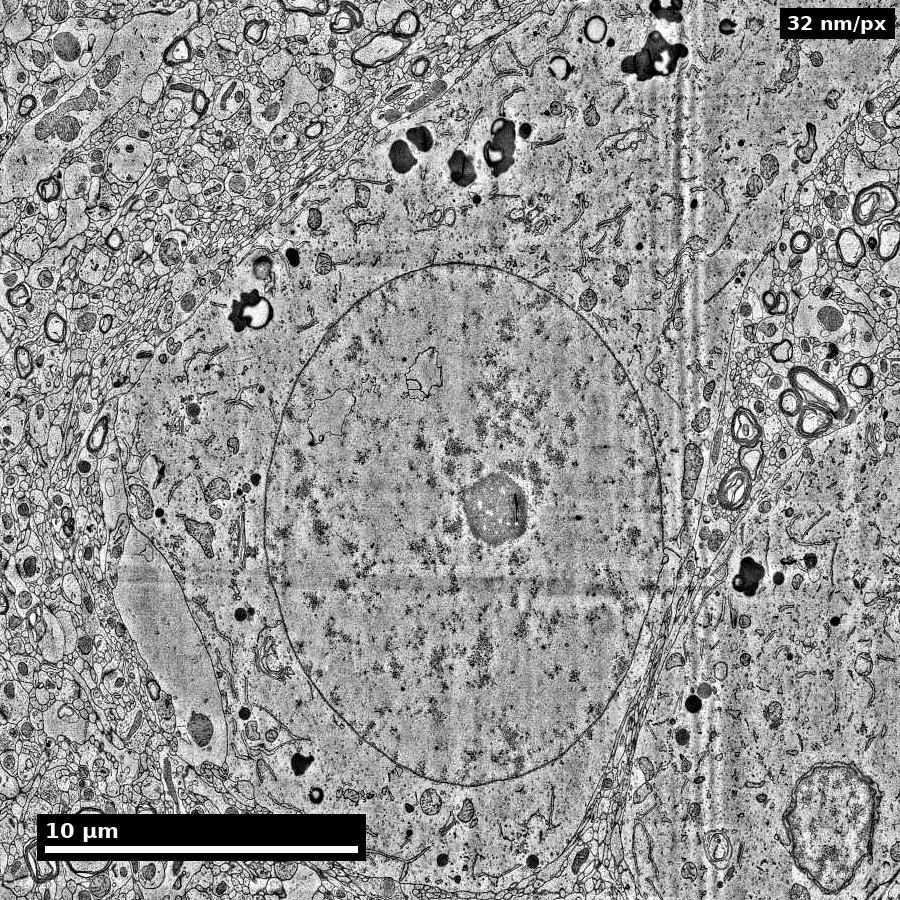
Slide line and file path
Marp:
File: /assets/images/content-library/case-studies/h01/05-neuron-soma.jpg ·
open full size
≈3.6 µm — native 4 nm resolution
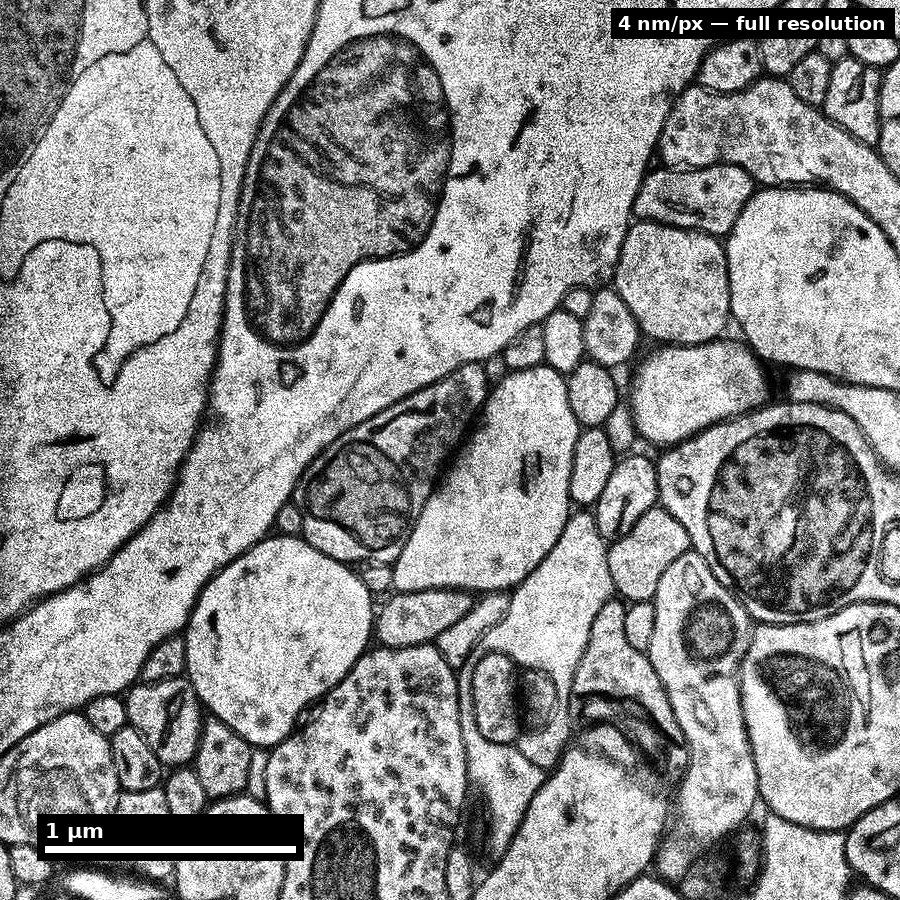
Slide line and file path
Marp:
File: /assets/images/content-library/case-studies/h01/07-synapse-level.jpg ·
open full size
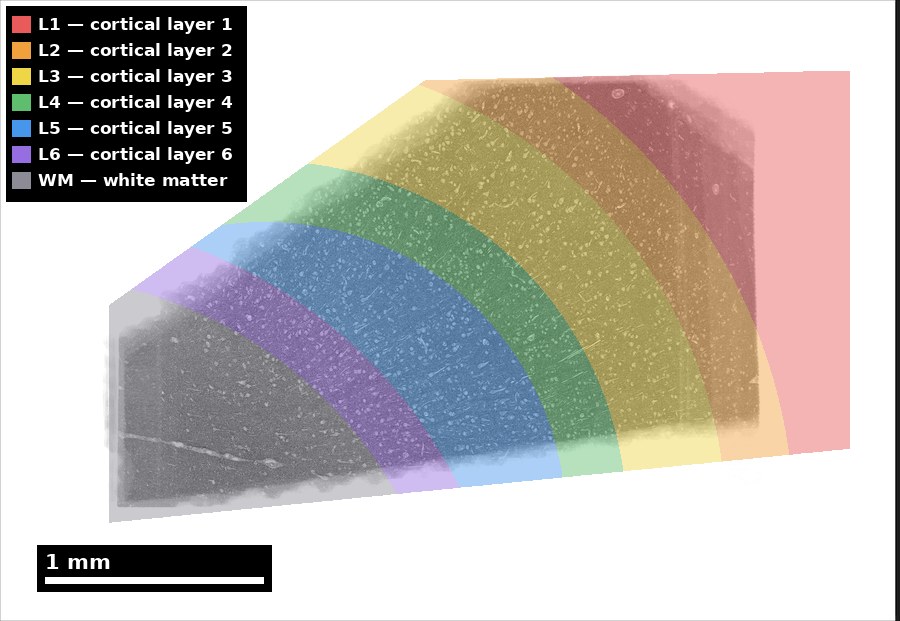
Cortical layers L1–L6 and white matter
Slide line and file path
Marp:
File: /assets/images/content-library/case-studies/h01/11-cortical-layers.jpg ·
open full size
Neuroanatomy
Structures located by querying H01’s own label layers, not chosen by eye.
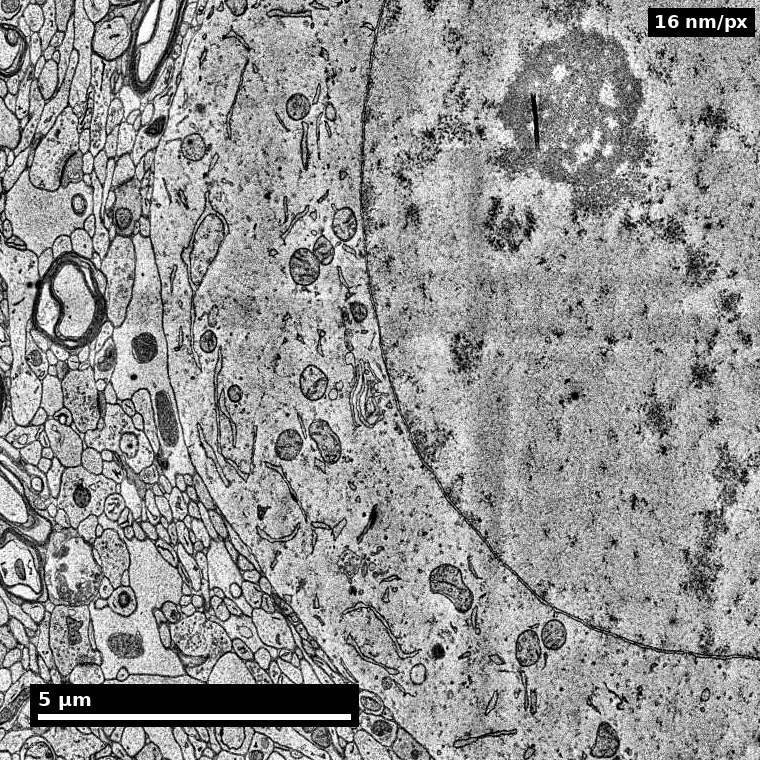
Neuronal soma
Slide line and file path
Marp:
File: /assets/images/content-library/em/soma-ultrastructure.jpg ·
open full size
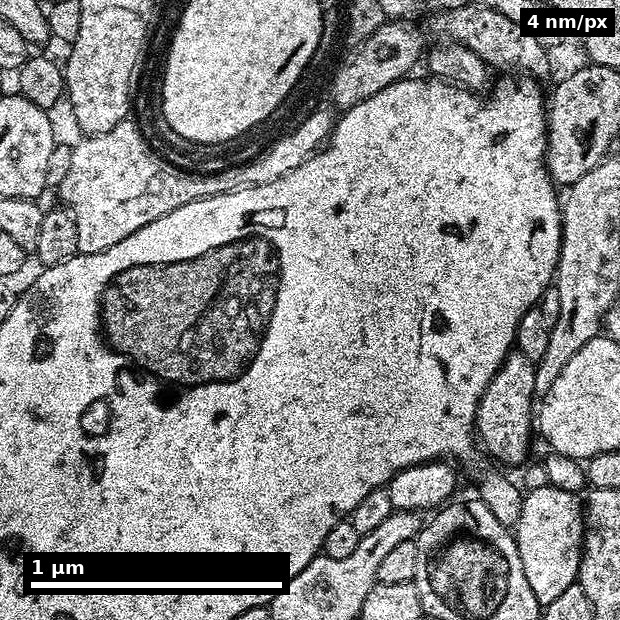
Dendrite and organelles
Slide line and file path
Marp:
File: /assets/images/content-library/em/dendrite-and-organelles.jpg ·
open full size
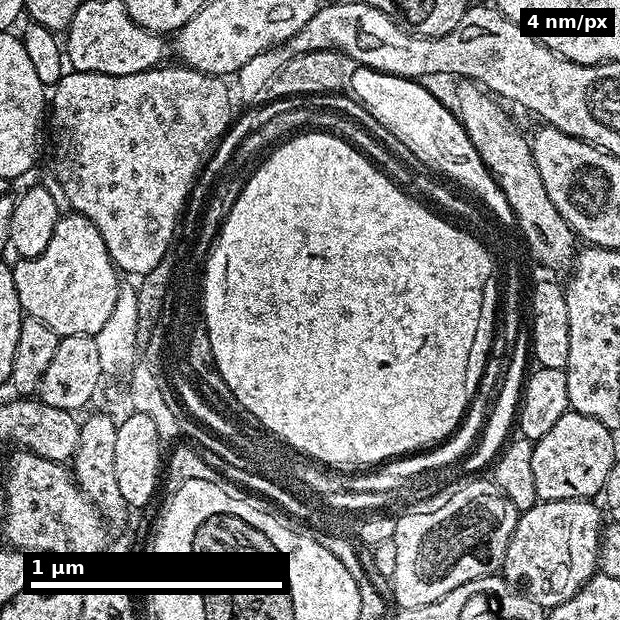
Myelinated axon
Slide line and file path
Marp:
File: /assets/images/content-library/em/myelinated-axon.jpg ·
open full size
Myelin across a grey-matter field
Slide line and file path
Marp:
File: /assets/images/content-library/em/myelin-in-grey-matter.jpg ·
open full size
Astrocytic process
Slide line and file path
Marp:
File: /assets/images/content-library/em/astrocyte-process.jpg ·
open full size
Cortical blood vessel
Slide line and file path
Marp:
File: /assets/images/content-library/em/blood-vessel.jpg ·
open full size
Excitatory vs inhibitory synapse
Slide line and file path
Marp:
File: /assets/images/content-library/em/synapse-asymmetric-vs-symmetric.jpg ·
open full size
Segmentation and proofreading
The figures that show a pipeline decision rather than a structure.
Classify these profiles, then check
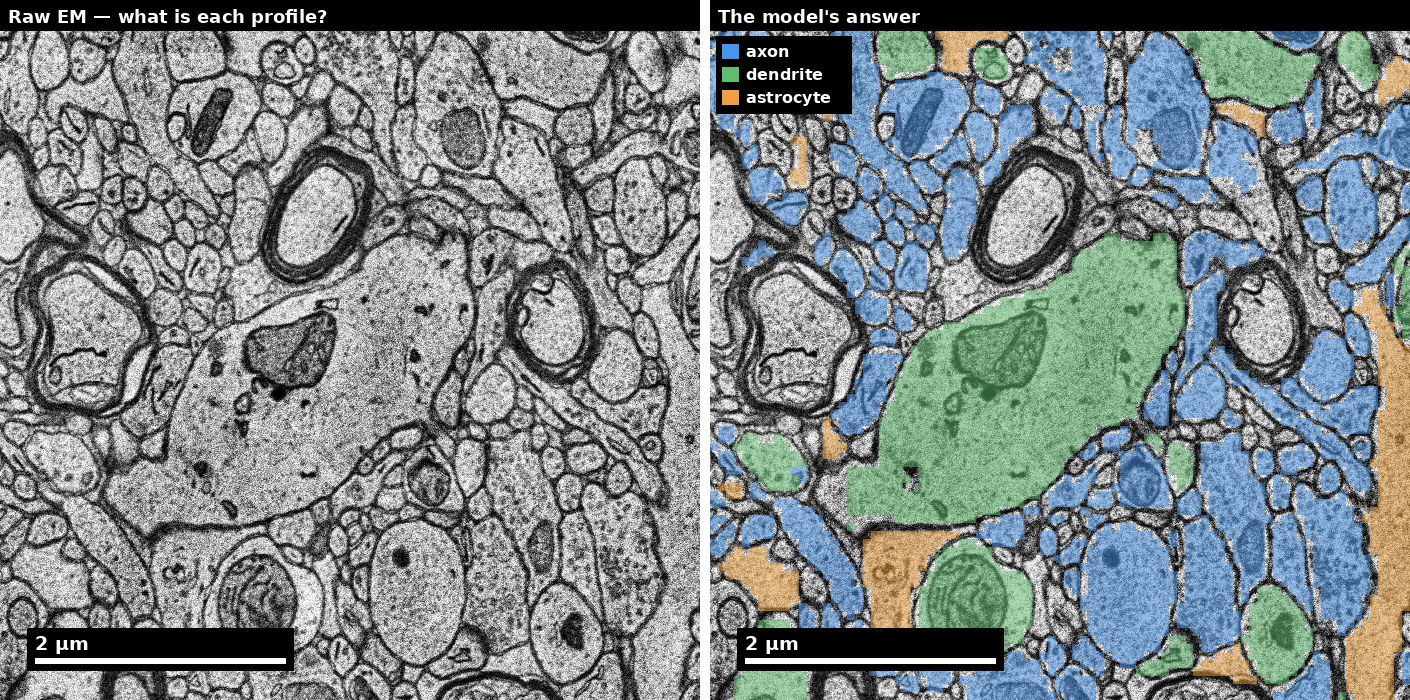
Slide line and file path
Marp:
File: /assets/images/content-library/em/neuropil-raw-vs-subcompartments.jpg ·
open full size
Flood-filling network output
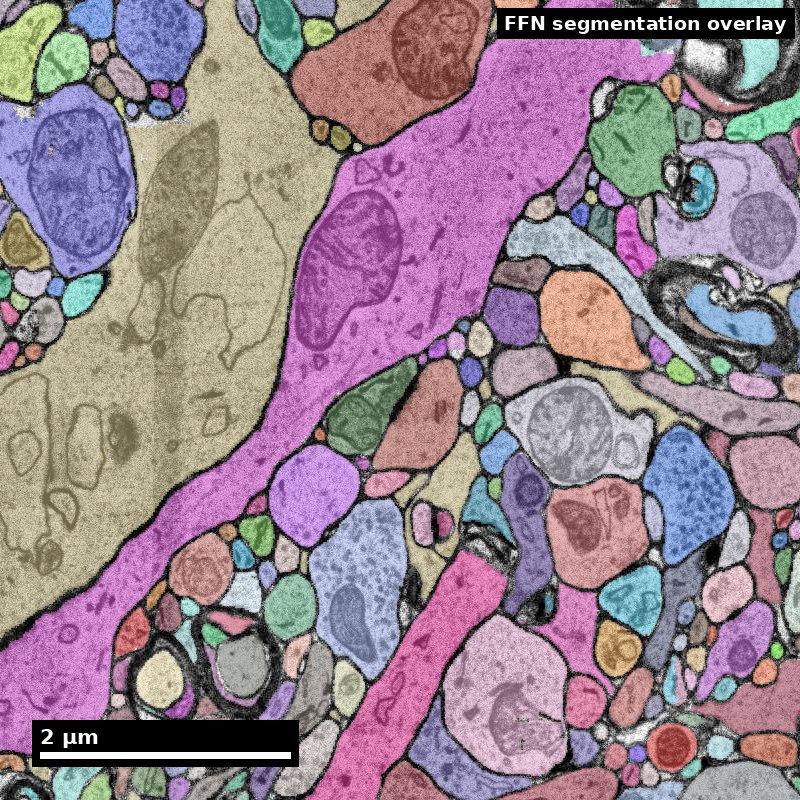
Slide line and file path
Marp:
File: /assets/images/content-library/case-studies/h01/10b-segmentation-overlay.jpg ·
open full size
The merge/split dial: c2 vs c3
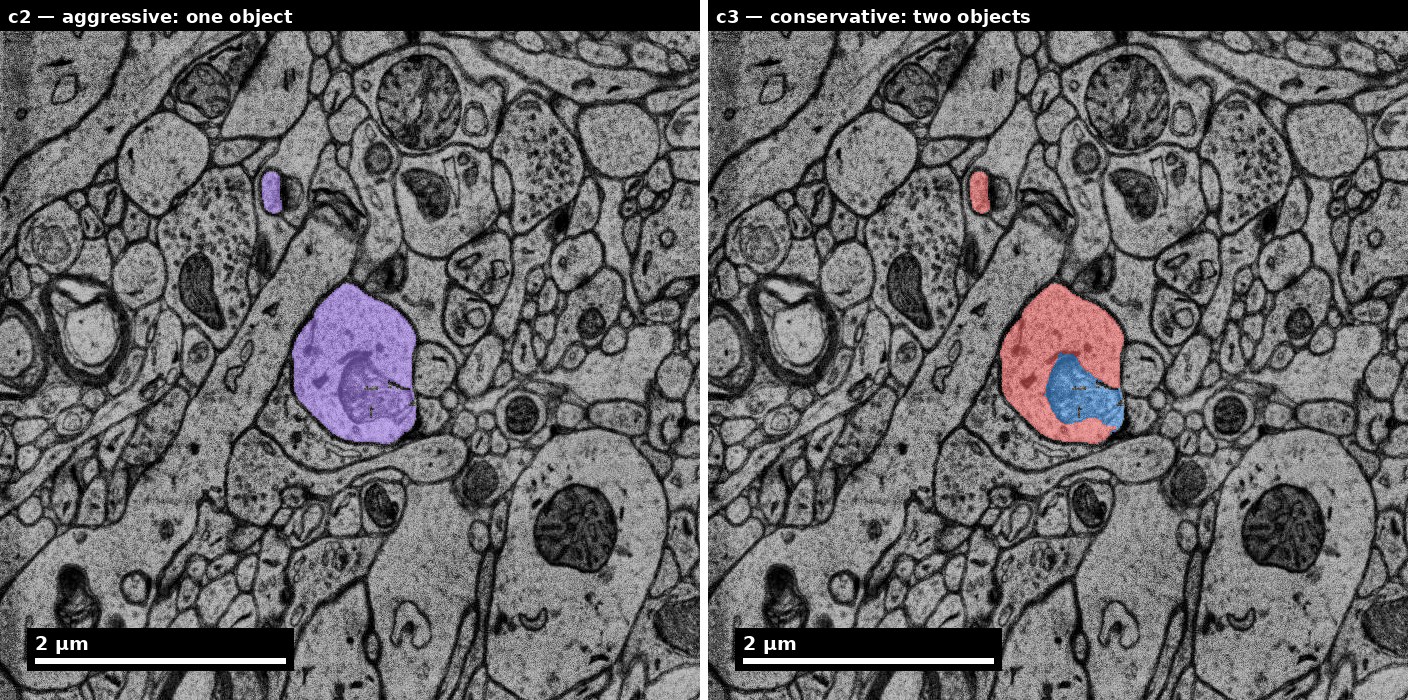
Slide line and file path
Marp:
File: /assets/images/content-library/em/segmentation-c2-vs-c3.jpg ·
open full size
Before and after a human fixed it
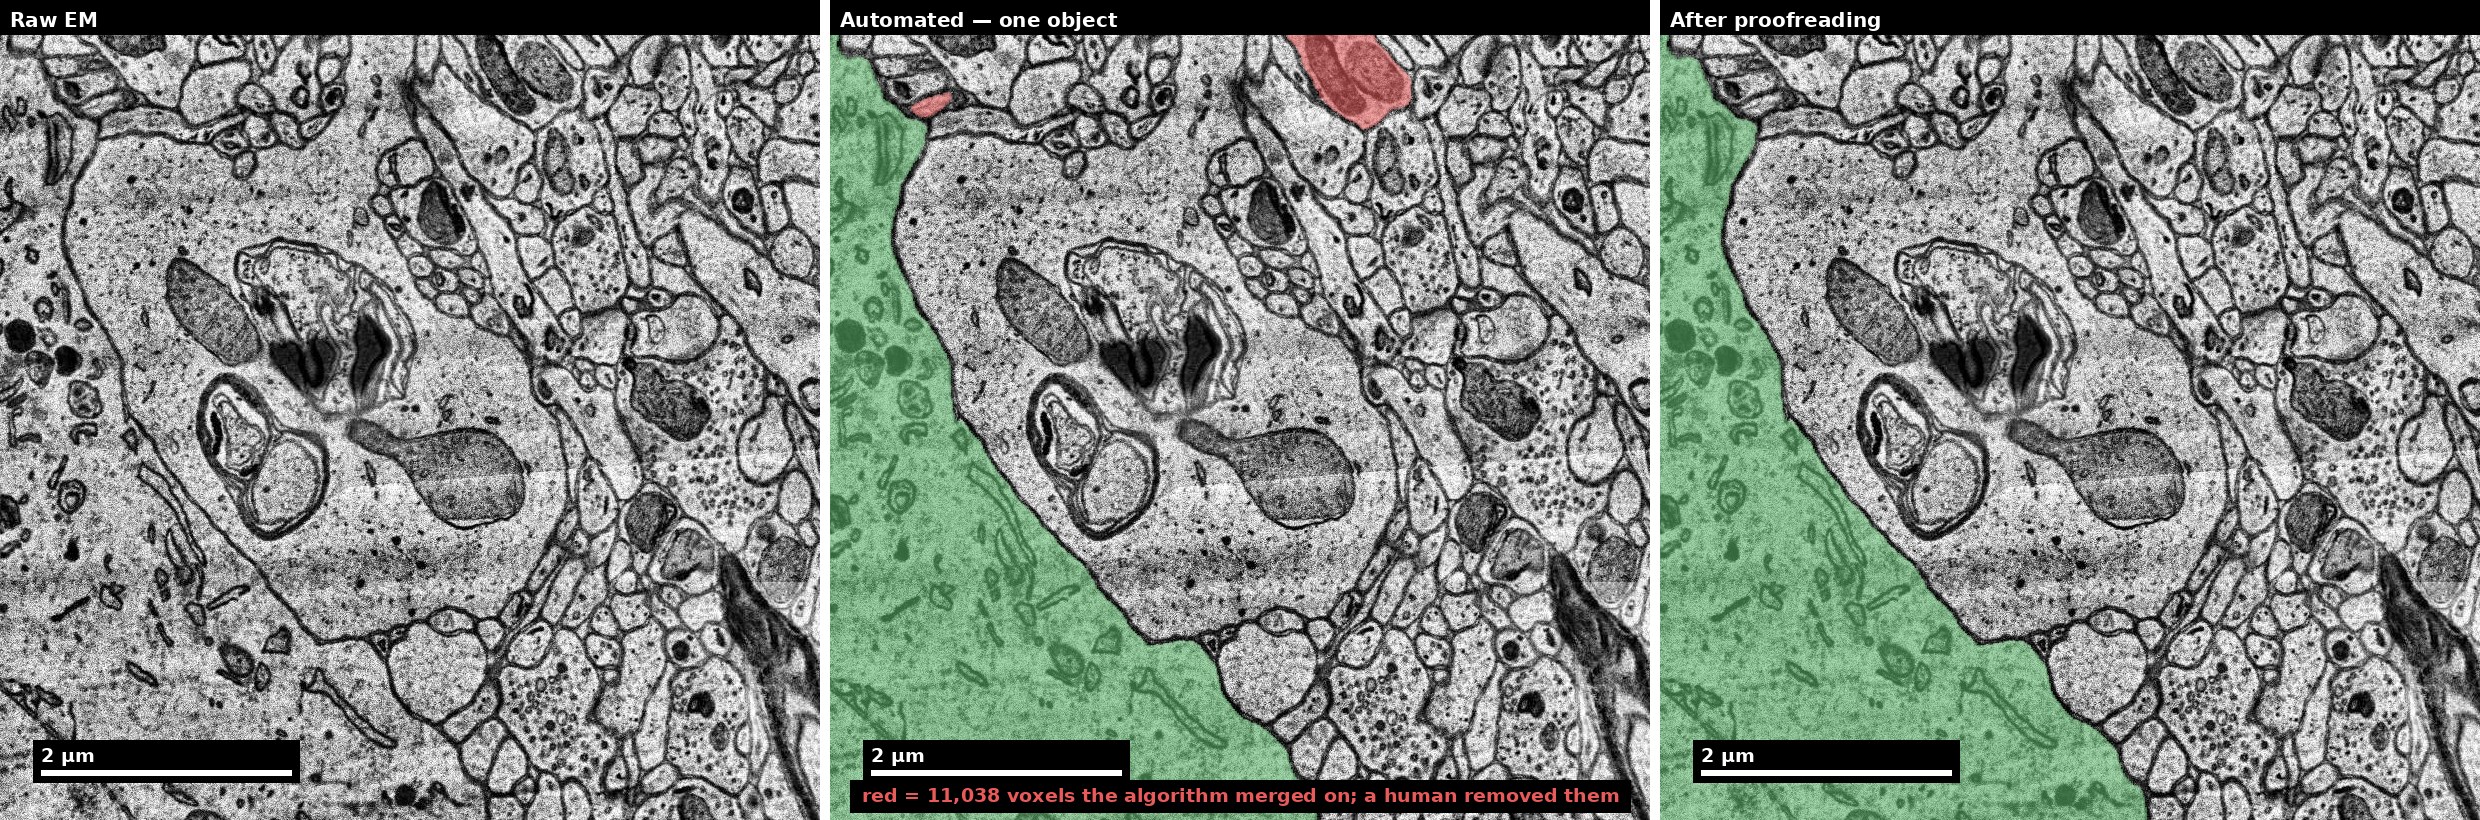
Slide line and file path
Marp:
File: /assets/images/content-library/em/proofreading-before-after.jpg ·
open full size
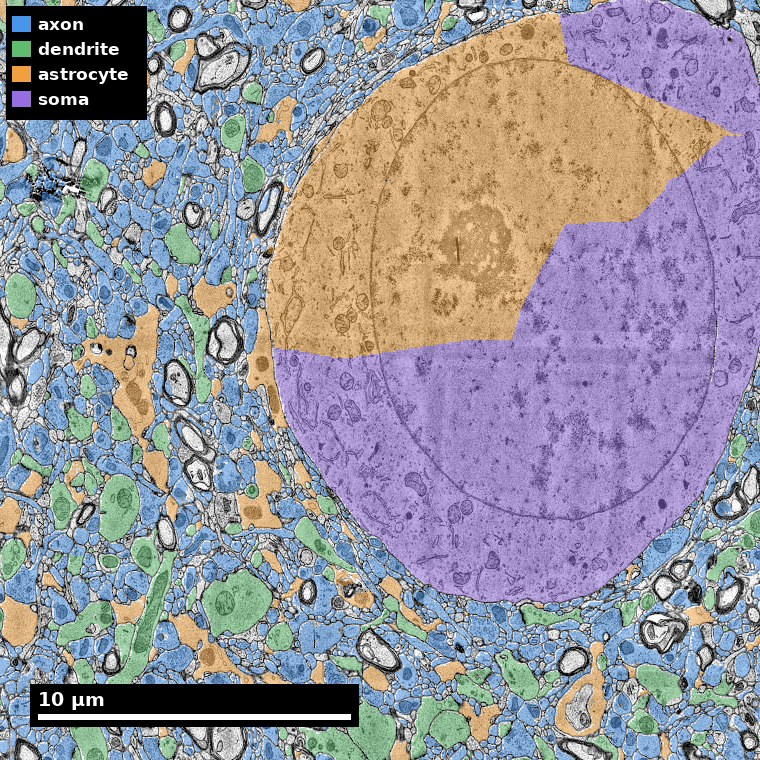
Six-class subcompartment model
Slide line and file path
Marp:
File: /assets/images/content-library/em/subcompartment-classes.jpg ·
open full size
Using these in a deck
The lesson decks under course/decks/marp/ already carry a selection of these.
To add another, paste its Marp line above into the deck source and re-render:
npm install --no-save @marp-team/marp-cli   # if you don't have it
./scripts/render_marp.sh
The render step is not optional: scripts/check_deck_freshness.rb records a
hash of every deck source at render time and fails CI if a source was edited
without re-rendering. That gate exists because 29 of 35 decks had silently gone
stale before it did.
What these figures deliberately do not show
Some things the pages describe are simply below this volume’s resolution, and a figure claiming otherwise would teach a measurement error. At 4 nm per pixel with 33 nm sections:
| Structure | Size | At 4 nm | Showable? |
|---|---|---|---|
| Synaptic vesicle | ~40 nm | 10 px | Yes |
| Type I PSD thickness | 30–50 nm | 8–12 px | Yes, but subtle |
| Spine neck | 100–200 nm | 25–50 px | Yes |
| Polyribosome rosette | ~100 nm cluster | ~25 px | Yes, as a cluster |
| Myelin period | 12 nm | 3 px | No — lamellae cannot be counted |
| Synaptic cleft width | 12 vs 20 nm | 3 vs 5 px | No — at the noise floor |
| AIS dense undercoat | 5–10 nm | 1–2.5 px | No |
| Gap junction gap | 2–3 nm | <1 px | No |
Anything needing a whole-cell shape — apical dendrites, interneuron morphologies, branching angles — needs a 3D mesh view rather than a single plane, and is not in this set.