
02 Brain Data Across Scales
Technical Training: Nanoscale Connectomics
Session outcomes (60 minutes)
- Match biological questions to minimal sufficient spatial/temporal scale.
- Choose representation transitions without losing inference-critical detail.
- Produce a scale-and-compute justification for one analysis plan.
Pedagogical arc
- Concept map: scale as an inference constraint.
- Modeling: question -> data product -> representation -> compute budget.
- Practice: learner selects scale stack for a case study.
- Check: defend tradeoffs under critique.
Why this matters
- Scale mismatch is a major source of invalid conclusions.
- Resolution, coverage, and compute are coupled design variables.
- “More data” does not fix wrong scale selection.
Visual context: multi-scale framing
- Instructor cue: ask what is visible here and what is fundamentally unobservable at this scale.
Visual context: analysis scale transition
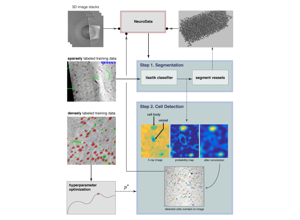
- Distinguish acquisition scale from analysis target scale.
Visual context: representational conversion risk
- Volume -> segmentation -> skeleton/mesh -> graph can remove critical geometry.
Scale-selection framework
- State estimand (what you will measure).
- Determine smallest scale that resolves that estimand.
- Verify coverage supports statistical claims.
- Define acceptable uncertainty due to downsampling/registration.
Representation tradeoffs
- Raw volume: maximal fidelity, expensive queries.
- Segmentation: workable objects, boundary errors matter.
- Skeleton: topology-focused, diameter context reduced.
- Graph: fast analytics, spatial nuance largely removed.
Registration and uncertainty propagation
- Report transform model and residuals.
- Track uncertainty by region, not only global means.
- Carry registration confidence into downstream confidence intervals.
Compute realism for scale planning
- Storage and IO growth are nonlinear with resolution/coverage.
- Query latency determines practical iteration speed.
- Budgeting is part of scientific method feasibility.
Misconceptions to correct explicitly
- “Higher resolution always better.”
- “Graph conversion is lossless enough for any question.”
- “Registration error averages out automatically.”
Think-Pair-Share (8 min)
Prompt: choose one hypothesis and argue for the minimum sufficient scale.
- Think: write one scale choice and one risk.
- Pair: challenge each other’s coverage assumptions.
- Share: class votes on most defensible tradeoff.
In-class activity
Create a one-page scale plan:
- question,
- estimand,
- acquisition scale,
- analysis representation,
- compute/storage estimate,
- boundary statement.
Rubric checkpoint
- Pass: scale and representation choices are consistent with estimand.
- Strong: explicit uncertainty and compute tradeoff documented.
- Flag: claims exceed observable detail at chosen scale.
External paper figure slots (add in final teaching run)
- Kasthuri et al. 2015 (dense microcircuit reconstruction) figure on scale and completeness.
- MICrONS consortium overview figure on multimodal scaling.
- H01/human cortex connectomics figure on data scale and processing implications.
Bridge
Next unit: EM prep and imaging decisions that set artifact and quality limits.