Slide 1 of 18
 Nanoscale · Module 23
Posters, Abstracts, and Conferences
Teaching Deck
Human cortex · H01
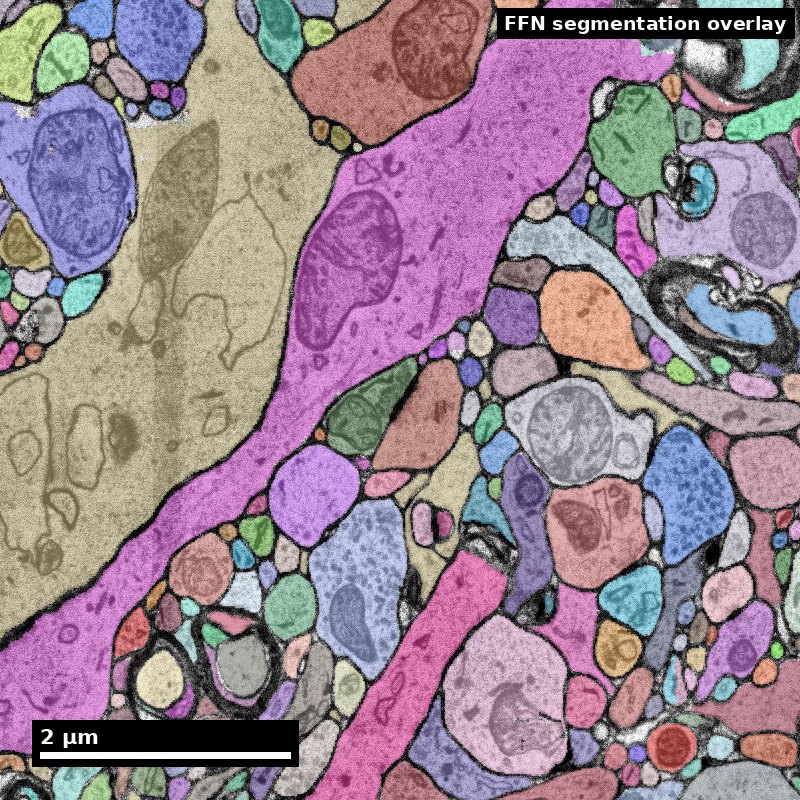
Object segmentation over electron microscopy
H01 release · Lichtman Lab / Harvard & Connectomics at Google · CC BY 4.0
Shapson-Coe et al. (2024) · doi:10.1126/science.adk4858
Slide 2 of 18
Learning Objectives
- Write a concise, evidence-grounded connectomics abstract
- Design a poster that foregrounds claim-evidence logic
- Deliver a clear 90-second poster pitch
- Use explicit conference norms for networking and Q&A
Slide 3 of 18
Capability Target
Submit a conference-ready abstract, produce a coherent poster draft, and deliver a defensible 90-second pitch with clear claim boundaries. Operationally: your abstract spends its word budget on evidence rather than motivation, a stranger can find your core result on the poster within ten seconds from two meters away, and you leave the session with at least two named follow-ups you initiated yourself.
Slide 4 of 18
Concept Focus
1) Abstracts are claim filters
- Technical: every sentence should move from question to method to result to implication, with one explicit limitation.
- Plain language: include only what helps reviewers evaluate credibility and significance. A reader deciding whether to walk to your poster needs to know what you found, not what the field hopes for.
- Misconception guardrail: a strong motivating paragraph can compensate for thin results.
Figure description and teaching notes
Further teaching detail from the module:
**Technical:** every sentence should move from question to method to result to implication, with one explicit limitation. Budget the words before writing: roughly 25 for the gap, 20 for the question, 50 for dataset and method, 90 for results with quantitative anchors, 25 for the limitation, 20 for the implication. Anything that does not fit is being funded by the results sentences, which is the wrong trade.
Slide 5 of 18
Core Workflow
- Distill the project into one claim hierarchy: one headline claim, at most two supporting claims, one limitation attached to each.
- Draft the 250-word abstract against the sentence budget, then delete every sentence that does not help a reviewer judge credibility or significance.
- Check the abstract names species, region, imaging modality, segmentation pipeline, version or materialization, proofreading state, and n. If any is missing, a reviewer will assume the worst case.
Slide 6 of 18
Core Workflow (continued)
- Build the poster wireframe around three evidence panels, placing the headline finding in the upper third where it is readable at two meters.
- Write and rehearse the 90-second and 3-minute versions. The 90-second version is not the 3-minute version spoken quickly; it is a different script with the background removed.
- Prepare a follow-up template and a target list of five to eight people you want to talk to, with one specific question for each.
Slide 7 of 18
Core Workflow (continued)
- Run critique for clarity, limitations, and the professional interaction plan, and revise before the submission deadline rather than after acceptance.
Slide 8 of 18
Run of Show (60 min)
- 00:00-08:00 | Framing + exemplar abstract
- 08:00-20:00 | Abstract sprint (individual)
- 20:00-32:00 | Poster wireframe build (pairs)
- 32:00-44:00 | 90-second pitch practice
Slide 9 of 18
Run of Show (60 min) (continued)
- 44:00-54:00 | Q&A and networking simulation
- 54:00-60:00 | Revision checklist + submission plan
Slide 10 of 18
Misconceptions to Watch
- Misconception guardrail: a strong motivating paragraph can compensate for thin results.
- Misconception guardrail: dense text signals that the work is thorough.
- Misconception guardrail: good science speaks for itself and networking is optional decoration.
- Misconception guardrail: if the conversation went well, the other person will follow up.
Slide 11 of 18
Studio Activity
Scenario: You have one accepted poster slot and must communicate your connectomics result to mixed audience members. Two of the people who stop are specialists who will ask about segmentation quality; one is a program director who will ask what it means; one is a peer at your own stage who wants your code.
Slide 12 of 18
Activity Output Checklist
- Evidence-linked artifact submitted.
- At least one limitation or uncertainty stated.
- Revision point captured from feedback.
Slide 13 of 18
Assessment Rubric
- Minimum pass: abstract claims are evidence-grounded and name dataset, version, and n; poster layout surfaces core result and limitation; the pitch communicates method, result, and limit within time.
- Strong performance: handles Q&A with precise uncertainty language, adapts to the audience in front of them without changing the evidentiary standard, and produces follow-ups that are specific, sent within days, and initiated rather than inherited from a supervisor.
Figure description and teaching notes
Further teaching detail from the module:
**Common failure to flag:** overstuffed abstracts with missing quantitative anchors, posters organized by chronology instead of argument, and overconfident responses to unresolved technical questions. Also flag a learner whose entire target list consists of people their supervisor already knows.
Slide 14 of 18
Assessment Rubric (continued)
- Common failure to flag: overstuffed abstracts with missing quantitative anchors, posters organized by chronology instead of argument, and overconfident responses to unresolved technical questions.
Slide 15 of 18
Exit Ticket
Write a 5-sentence mini-abstract including question, method with dataset version, result with one number, limitation, and implication. Then count how many words went to the field and how many to your result; if the first number is larger, rewrite the opening sentence.
Slide 16 of 18
References (Instructor)
- White et al. (1986) and modern connectomics papers as abstract exemplars.
- Journal club set for evidence-first claim style.
Slide 17 of 18
Teaching Materials
- Module page: /modules/module23/
- Session kit: /teaching/sessions/module23/
- Worksheet: /assets/worksheets/module23/module23-activity.md
Slide 18 of 18
Read, review, or teach
The reading version includes figure descriptions and discussion guidance.
Nanoscale text: CC BY 4.0. Scientific figures retain their individual credits.