Slide 1 of 21
 Nanoscale · Module 13
Machine Learning in Neuroscience
Teaching Deck
Human cortex · H01
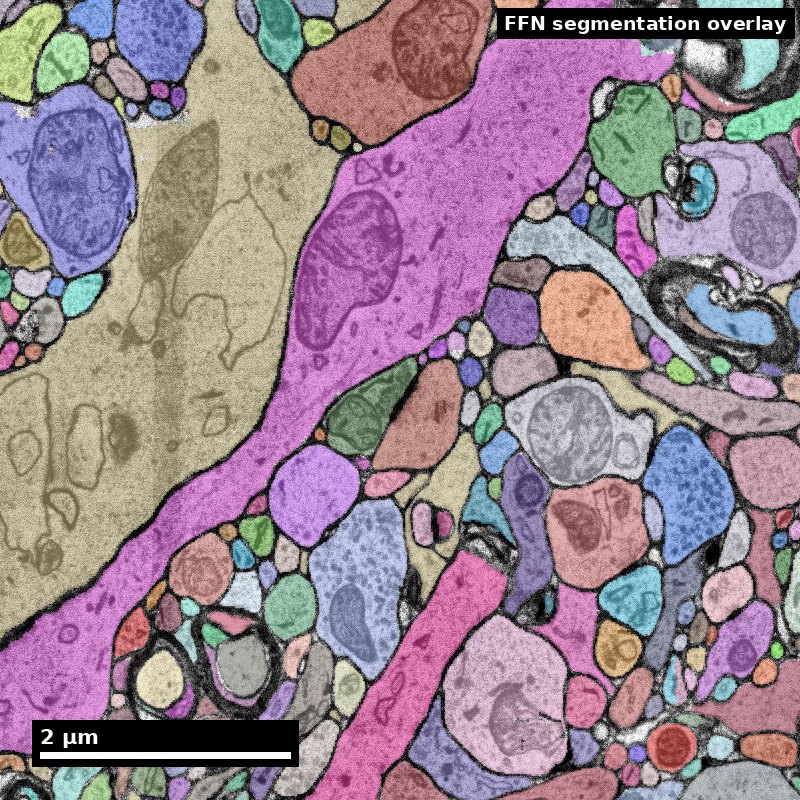
Object segmentation over electron microscopy
H01 release · Lichtman Lab / Harvard & Connectomics at Google · CC BY 4.0
Shapson-Coe et al. (2024) · doi:10.1126/science.adk4858
Slide 2 of 21
Learning Objectives
- Build feature pipelines for neuron and synapse-level analyses
- Compare supervised and unsupervised methods for connectomics tasks
- Evaluate model quality with biologically meaningful metrics
- Detect data leakage and distribution-shift risks in connectomics ML
Slide 3 of 21
Capability Target
Design and critique an ML analysis pipeline for connectomics that includes feature rationale, evaluation plan, leakage controls, and interpretation limits. Concretely: choose a split strategy from the leakage channels present in your data rather than from convention, pick metrics from the decision the model will support, quantify how much of your reported performance survives a harder split, and write a limitation statement specific enough that a reader knows which uses of your model you would refuse.
Slide 4 of 21
Concept Focus
1) Feature engineering defines the hypothesis space
- Technical: feature choices encode assumptions about what variation is biologically meaningful.
- Plain language: your model can only learn what your features allow, and it will learn the easiest thing they allow.
- Misconception guardrail: adding more features always improves science.
Figure description and teaching notes
Further teaching detail from the module:
**Technical:** feature choices encode assumptions about what variation is biologically meaningful. For a neurite-fragment classifier a defensible starting set is skeleton path length, mean and variance of caliber, branch count, tortuosity, synapse count as presynaptic and as postsynaptic partner, and mitochondrial volume fraction — each of which corresponds to a cue a human annotator actually uses. Every feature you add also adds a way for the model to identify the *dataset* rather than the *biology*: raw intensity statistics, for instance, encode staining batch almost perfectly.
Slide 5 of 21
Core Workflow
- Write the biological decision the model will support, naming who acts on the output and what they do differently as a result.
- Enumerate leakage channels present in your data — fragment duplication, spatial adjacency, annotator provenance, label circularity — and choose the split that blocks the strongest one.
- Construct the feature set with a one-line rationale per feature, and record the segmentation version the features were computed from.
Slide 6 of 21
Core Workflow (continued)
- Fit all preprocessing (scaling, imputation, feature selection) inside the training fold only.
- Train a trivial baseline first — majority class, or a single-feature threshold — and report it alongside every later model.
- Evaluate with the metric that matches the decision from step 1, plus per-class recall and prevalence.
- Run error analysis on the failures: sample 20-30 misclassified examples and classify the failure reason by hand.
Slide 7 of 21
Core Workflow (continued)
- Write the model card: intended use, unsupported uses, evaluation splits, metrics with intervals, and the domain in which the numbers hold.
Slide 8 of 21
Run of Show (60 min)
- 00:00-08:00 | Task framing and leakage examples
- 08:00-20:00 | Feature rationale workshop
- 20:00-34:00 | Split strategy and baseline modeling
- 34:00-46:00 | Error analysis and biologically relevant metrics
Slide 9 of 21
Run of Show (60 min) (continued)
- 46:00-56:00 | Model-card limitation writing
- 56:00-60:00 | Competency checkpoint
Slide 10 of 21
Misconceptions to Watch
- Misconception guardrail: adding more features always improves science.
- Misconception guardrail: one summary metric is enough.
- Misconception guardrail: a random split always gives a valid generalization estimate.
- Misconception guardrail: a 99% accurate classifier is a useful classifier.
Slide 11 of 21
Misconceptions to Watch (continued)
- Misconception guardrail: the training labels are the truth the model is failing to reach.
Slide 12 of 21
Studio Activity
Scenario: You must classify neurite fragments into coarse categories to prioritize a proofreading queue. You have roughly 4,000 labeled fragments drawn from about 600 neurons in one dataset, five classes with prevalences of approximately 38%, 27%, 19%, 12%, and 4%, and a reviewer team that can inspect 500 segments per week. A second, differently stained dataset is available as a held-out domain.
Slide 13 of 21
Activity Output Checklist
- Evidence-linked artifact submitted.
- At least one limitation or uncertainty stated.
- Revision point captured from feedback.
Slide 14 of 21
Assessment Rubric
Minimum pass
- Feature and split decisions are justified against a named leakage channel.
- Metrics include at least one biologically targeted criterion tied to a real capacity or threshold.
- Limitation statement is specific and actionable.
Slide 15 of 21
Assessment Rubric
Strong performance
- Quantifies how much performance each successive split control removes.
- Uses error analysis to propose the next data improvement rather than the next model.
- Names the assumption behind the chosen block size or grouping in the same sentence as the number.
Slide 16 of 21
Assessment Rubric (continued)
- Distinguishes an exploratory model from a deployment-ready one and states what would have to change.
Slide 17 of 21
Assessment Rubric
Common failure modes
- Leakage-prone random splits on spatially correlated data.
- Overfocus on aggregate accuracy with prevalence unreported.
- Claims of biological insight unsupported by model diagnostics.
- Features computed against an unpinned segmentation version.
Slide 18 of 21
Exit Ticket
For one candidate model, write:
- one plausible leakage pathway,
- one metric blind spot,
- one limitation you would report publicly.
Slide 19 of 21
References (Instructor)
- Januszewski et al. (2018) for segmentation ML context.
- UMAP paper (McInnes et al., 2018) for embedding interpretation caveats.
- MICrONS/FlyWire analyses for realistic distribution-shift context.
Slide 20 of 21
Teaching Materials
- Module page: /modules/module13/
- Session kit: /teaching/sessions/module13/
- Worksheet: /assets/worksheets/module13/module13-activity.md
Slide 21 of 21
Read, review, or teach
The reading version includes figure descriptions and discussion guidance.
Nanoscale text: CC BY 4.0. Scientific figures retain their individual credits.