Slide 1 of 20
 Nanoscale · Module 10
Network Science and Graph Representation
Teaching Deck
Human cortex · H01
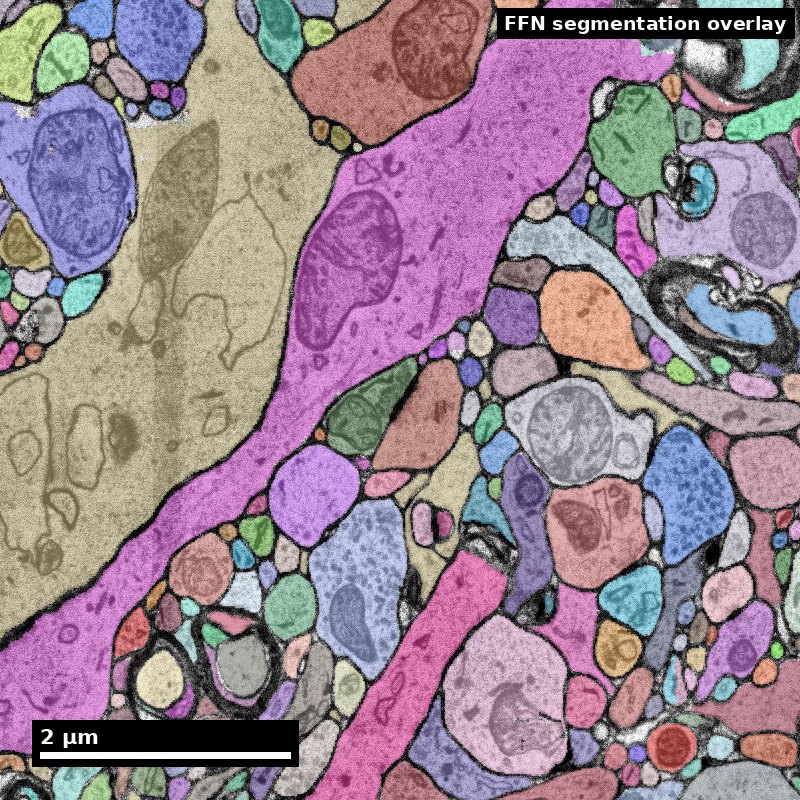
Object segmentation over electron microscopy
H01 release · Lichtman Lab / Harvard & Connectomics at Google · CC BY 4.0
Shapson-Coe et al. (2024) · doi:10.1126/science.adk4858
Slide 2 of 20
Learning Objectives
- Construct graph representations from connectomics data
- Compute and interpret core network metrics
- Choose graph abstractions appropriate to specific hypotheses
- Report assumptions and limits of graph-level conclusions
Slide 3 of 20
Capability Target
Build one connectome graph representation and justify two metric choices for a defined hypothesis.
Slide 4 of 20
Concept Focus
1) From EM to graph: a lossy transformation
A connectome graph is an abstraction. The path from EM images to a graph involves: raw images → segmentation → synapse detection → neuron-to-neuron edge list → graph. Each step loses information: the graph retains connectivity topology but discards spatial relationships, organelle details, and membrane geometry. This is a feature (graphs are computationally efficient and analytically tractable) and a limitation (the graph cannot answer questions that require spatial context).
Slide 5 of 20
Core Workflow
- Define node/edge schema: what are your nodes, what are your edges, what weighting scheme?
- Construct graph from synapse table (e.g., using CAVEclient + NetworkX). Inspect: number of nodes, edges, density, connected components.
- Compute candidate metrics: degree distribution, clustering, path length, reciprocity, modularity.
- Compare each metric to null-model expectation (degree-preserving random graph as minimum).
Slide 6 of 20
Core Workflow (continued)
- Interpret metrics against hypothesis. Report which metrics are significant and which are not.
- Document abstraction limits: what information was lost in the graph construction?
Slide 7 of 20
Run of Show (60 min)
- 00:00-08:00 | Graph abstraction choices
- 08:00-20:00 | Graph build demo
- 20:00-34:00 | Metric computation
- 34:00-46:00 | Interpretation and null concerns
Figure description and teaching notes
Pre-class preparation (10 min async)
Read the graph representations content library entry
Install NetworkX: `pip install networkx`
Minute-by-minute plan
00:00-08:00 | Graph abstraction choices
Show the same circuit as: (a) 3D EM rendering, (b) adjacency matrix, (c) node-link diagram. "These are three views of the same biology. Today we work with (b) and (c)."
Discussion: "What did we gain and lose in each transformation?"
08:00-20:00 | Graph build demo
Live coding: load a synapse table, construct a NetworkX DiGraph, apply threshold, print basic stats.
Visualize the graph with spring layout. Color nodes by cell type.
"Notice: the spatial layout in this diagram is arbitrary. The graph doesn't know where neurons are in the brain."
20:00-34:00 | Metric computation
Hands-on: learners compute degree distribution, clustering coefficient, and average path length.
Plot degree distribution (log-log). Is it heavy-tailed?
Compute clustering and compare to a random graph (NetworkX: `nx.watts_strogatz_graph` for comparison).
34:00-46:00 | Interpretation and null concerns
"Your clustering coefficient is 3× higher than the random graph. What does that mean biologically?"
Discuss: spatial proximity as a confound. Would a spatially constrained null model change the conclusion?
Walk through one example: reciprocal connections. Count in real data vs degree-preserving null.
46:00-60:00 | Competency check
Each learner writes a 1-paragraph graph analysis summary:
Schema (nodes, edges, threshold)
Two metrics with values and null-model comparisons
One biological interpretation and one limitation
Exit ticket: "Name one reason a graph metric might be misleading in your dataset."
Slide 8 of 20
Run of Show (60 min) (continued)
- 46:00-60:00 | Competency check
Slide 9 of 20
Misconceptions to Watch
- Misconception guardrail: the connectivity graph is the data, rather than one lossy projection of it that discards all geometry.
- Misconception guardrail: the synapse threshold is a technical detail that does not need reporting.
- Misconception guardrail: a graph metric means the same thing biologically as it does in its original network-science context.
- Misconception guardrail: Erdos-Renyi is an acceptable null for a spatially embedded, degree-heterogeneous connectome.
Slide 10 of 20
Studio Activity
Scenario: You have the connectivity graph of 500 neurons in a cortical column from the MICrONS dataset. Your PI asks: "Is this circuit small-world? Are there hub neurons? Are there communities?"
Slide 11 of 20
Activity Output Checklist
- Evidence-linked artifact submitted.
- At least one limitation or uncertainty stated.
- Revision point captured from feedback.
Slide 12 of 20
Assessment Rubric
Minimum pass
- The node/edge schema is stated explicitly — node definition, edge direction, weighting, and synapse threshold — before any metric appears.
- Each reported metric is paired with a null-model comparison; no bare metric values stand alone.
- At least two metrics are linked in writing to the specific question they answer for the PI's three asks (small-world, hubs, communities).
Slide 13 of 20
Assessment Rubric (continued)
- The report names at least one piece of information the graph abstraction discarded and one question it therefore cannot answer.
Slide 14 of 20
Assessment Rubric
Strong performance
- The headline result is re-run at a second synapse threshold, and the report states which conclusions held and which moved.
- Degree outliers are checked against the underlying reconstruction before being reported as hubs, with the check documented.
- More than one null model is used, or the limits of the single null are stated in words (what it does and does not control for).
Slide 15 of 20
Assessment Rubric (continued)
- Detected communities are compared against external labels (cell types), and disagreement is reported as a finding rather than suppressed.
Slide 16 of 20
Assessment Rubric
Common failure to flag
- Metric dumping — computing every available metric without explaining what question each answers.
- Hub or community claims made without checking whether a merge error or threshold choice manufactured them.
- A significance claim against Erdos-Renyi only, on a graph with obvious degree heterogeneity.
Slide 17 of 20
Exit Ticket
State one reason a graph metric might be misleading in your current dataset.
Slide 18 of 20
References (Instructor)
- Use module references listed on the module page.
Slide 19 of 20
Teaching Materials
- Module page: /modules/module10/
- Session kit: /teaching/sessions/module10/
- Worksheet: /assets/worksheets/module10/module10-activity.md
Slide 20 of 20
Read, review, or teach
The reading version includes figure descriptions and discussion guidance.
Nanoscale text: CC BY 4.0. Scientific figures retain their individual credits.